A Guide through the VyPR Analysis Environment
A more complex formula
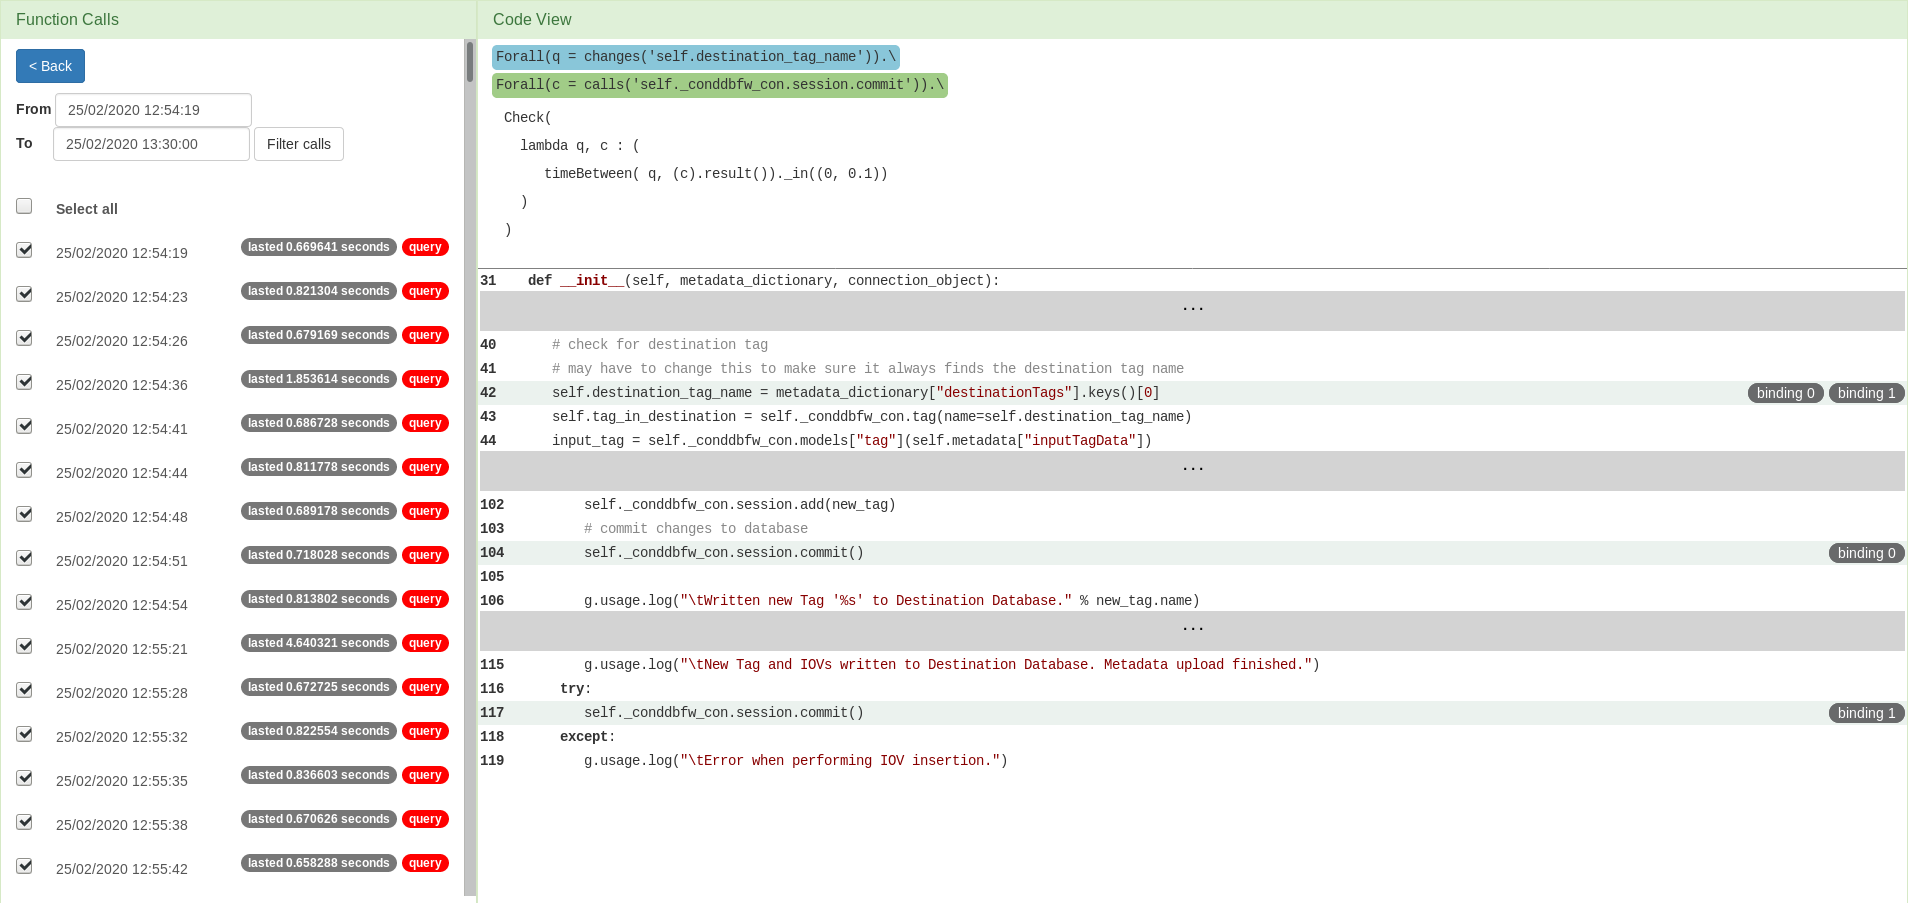
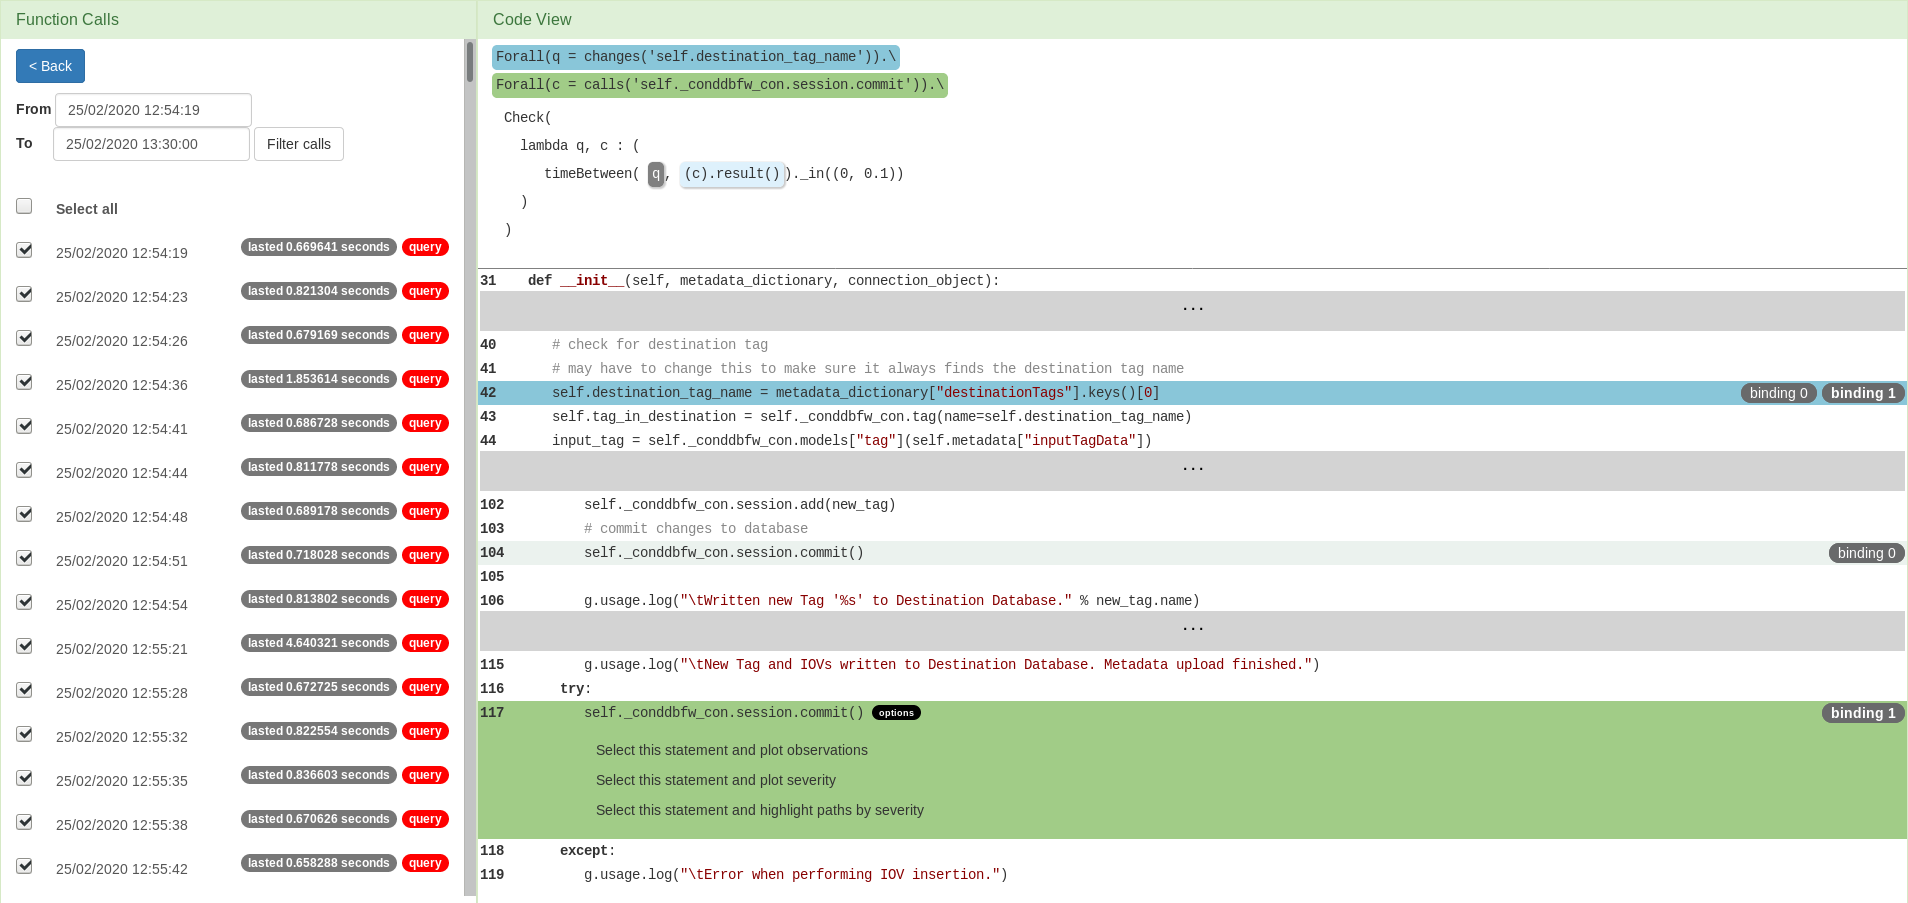
The queries that set a constraint over the program run can be different than the one we have seen so far. Let's take a look at one that, instead of measuring the duration of a single function call, selects two points of interest in the code and observes the time that the program run takes between those points. The formula shown below selects a point at which the variable called self.destination_tag_name changes and a point at which function self._conddbfw_con.session.commit is called and states that the program run should take no more than 0.1 seconds to get from the first one to the other.
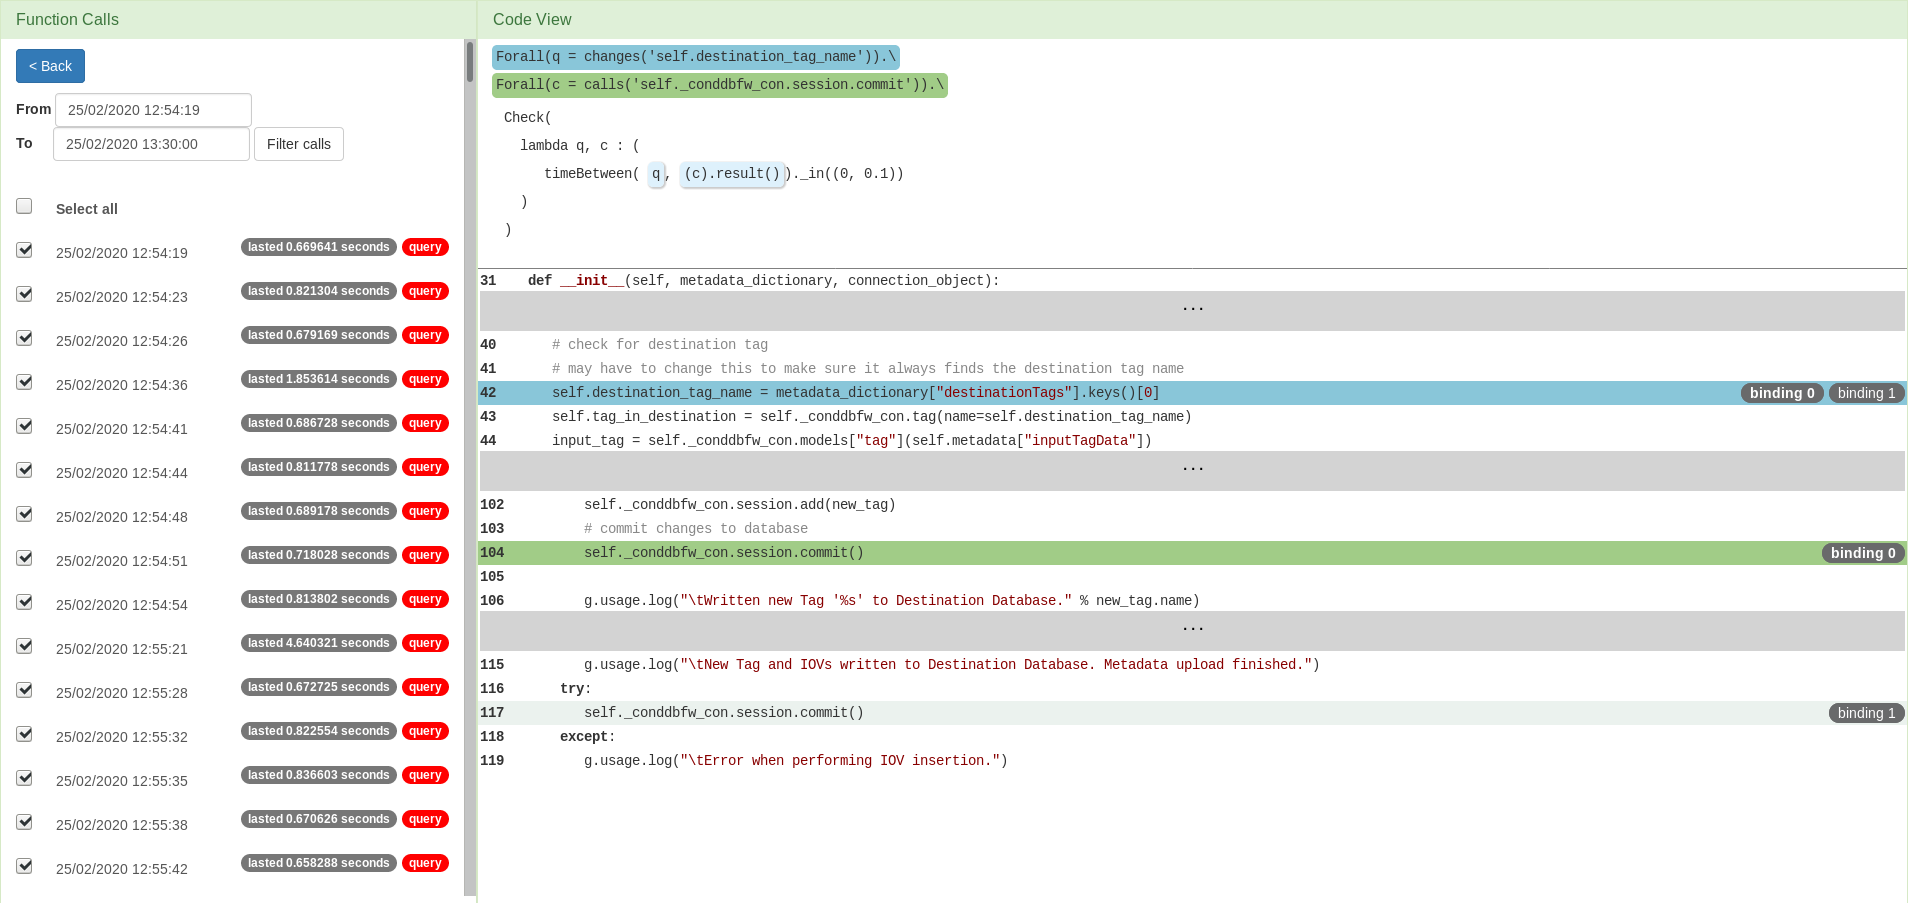
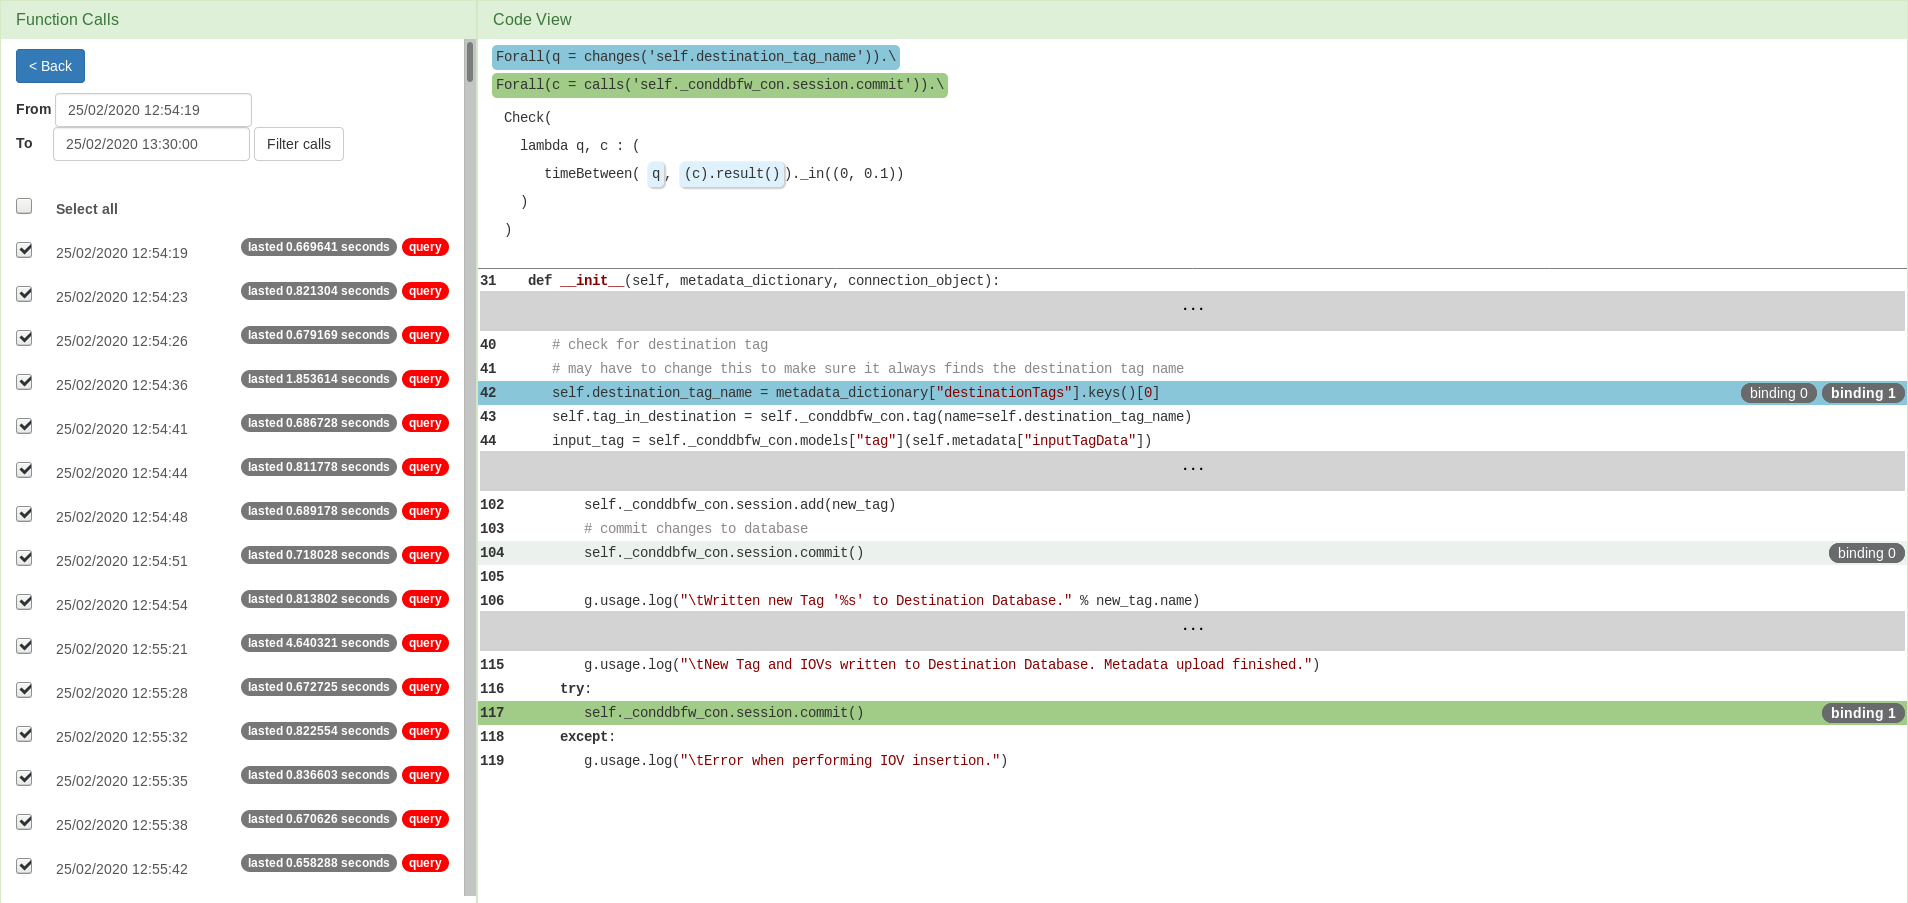
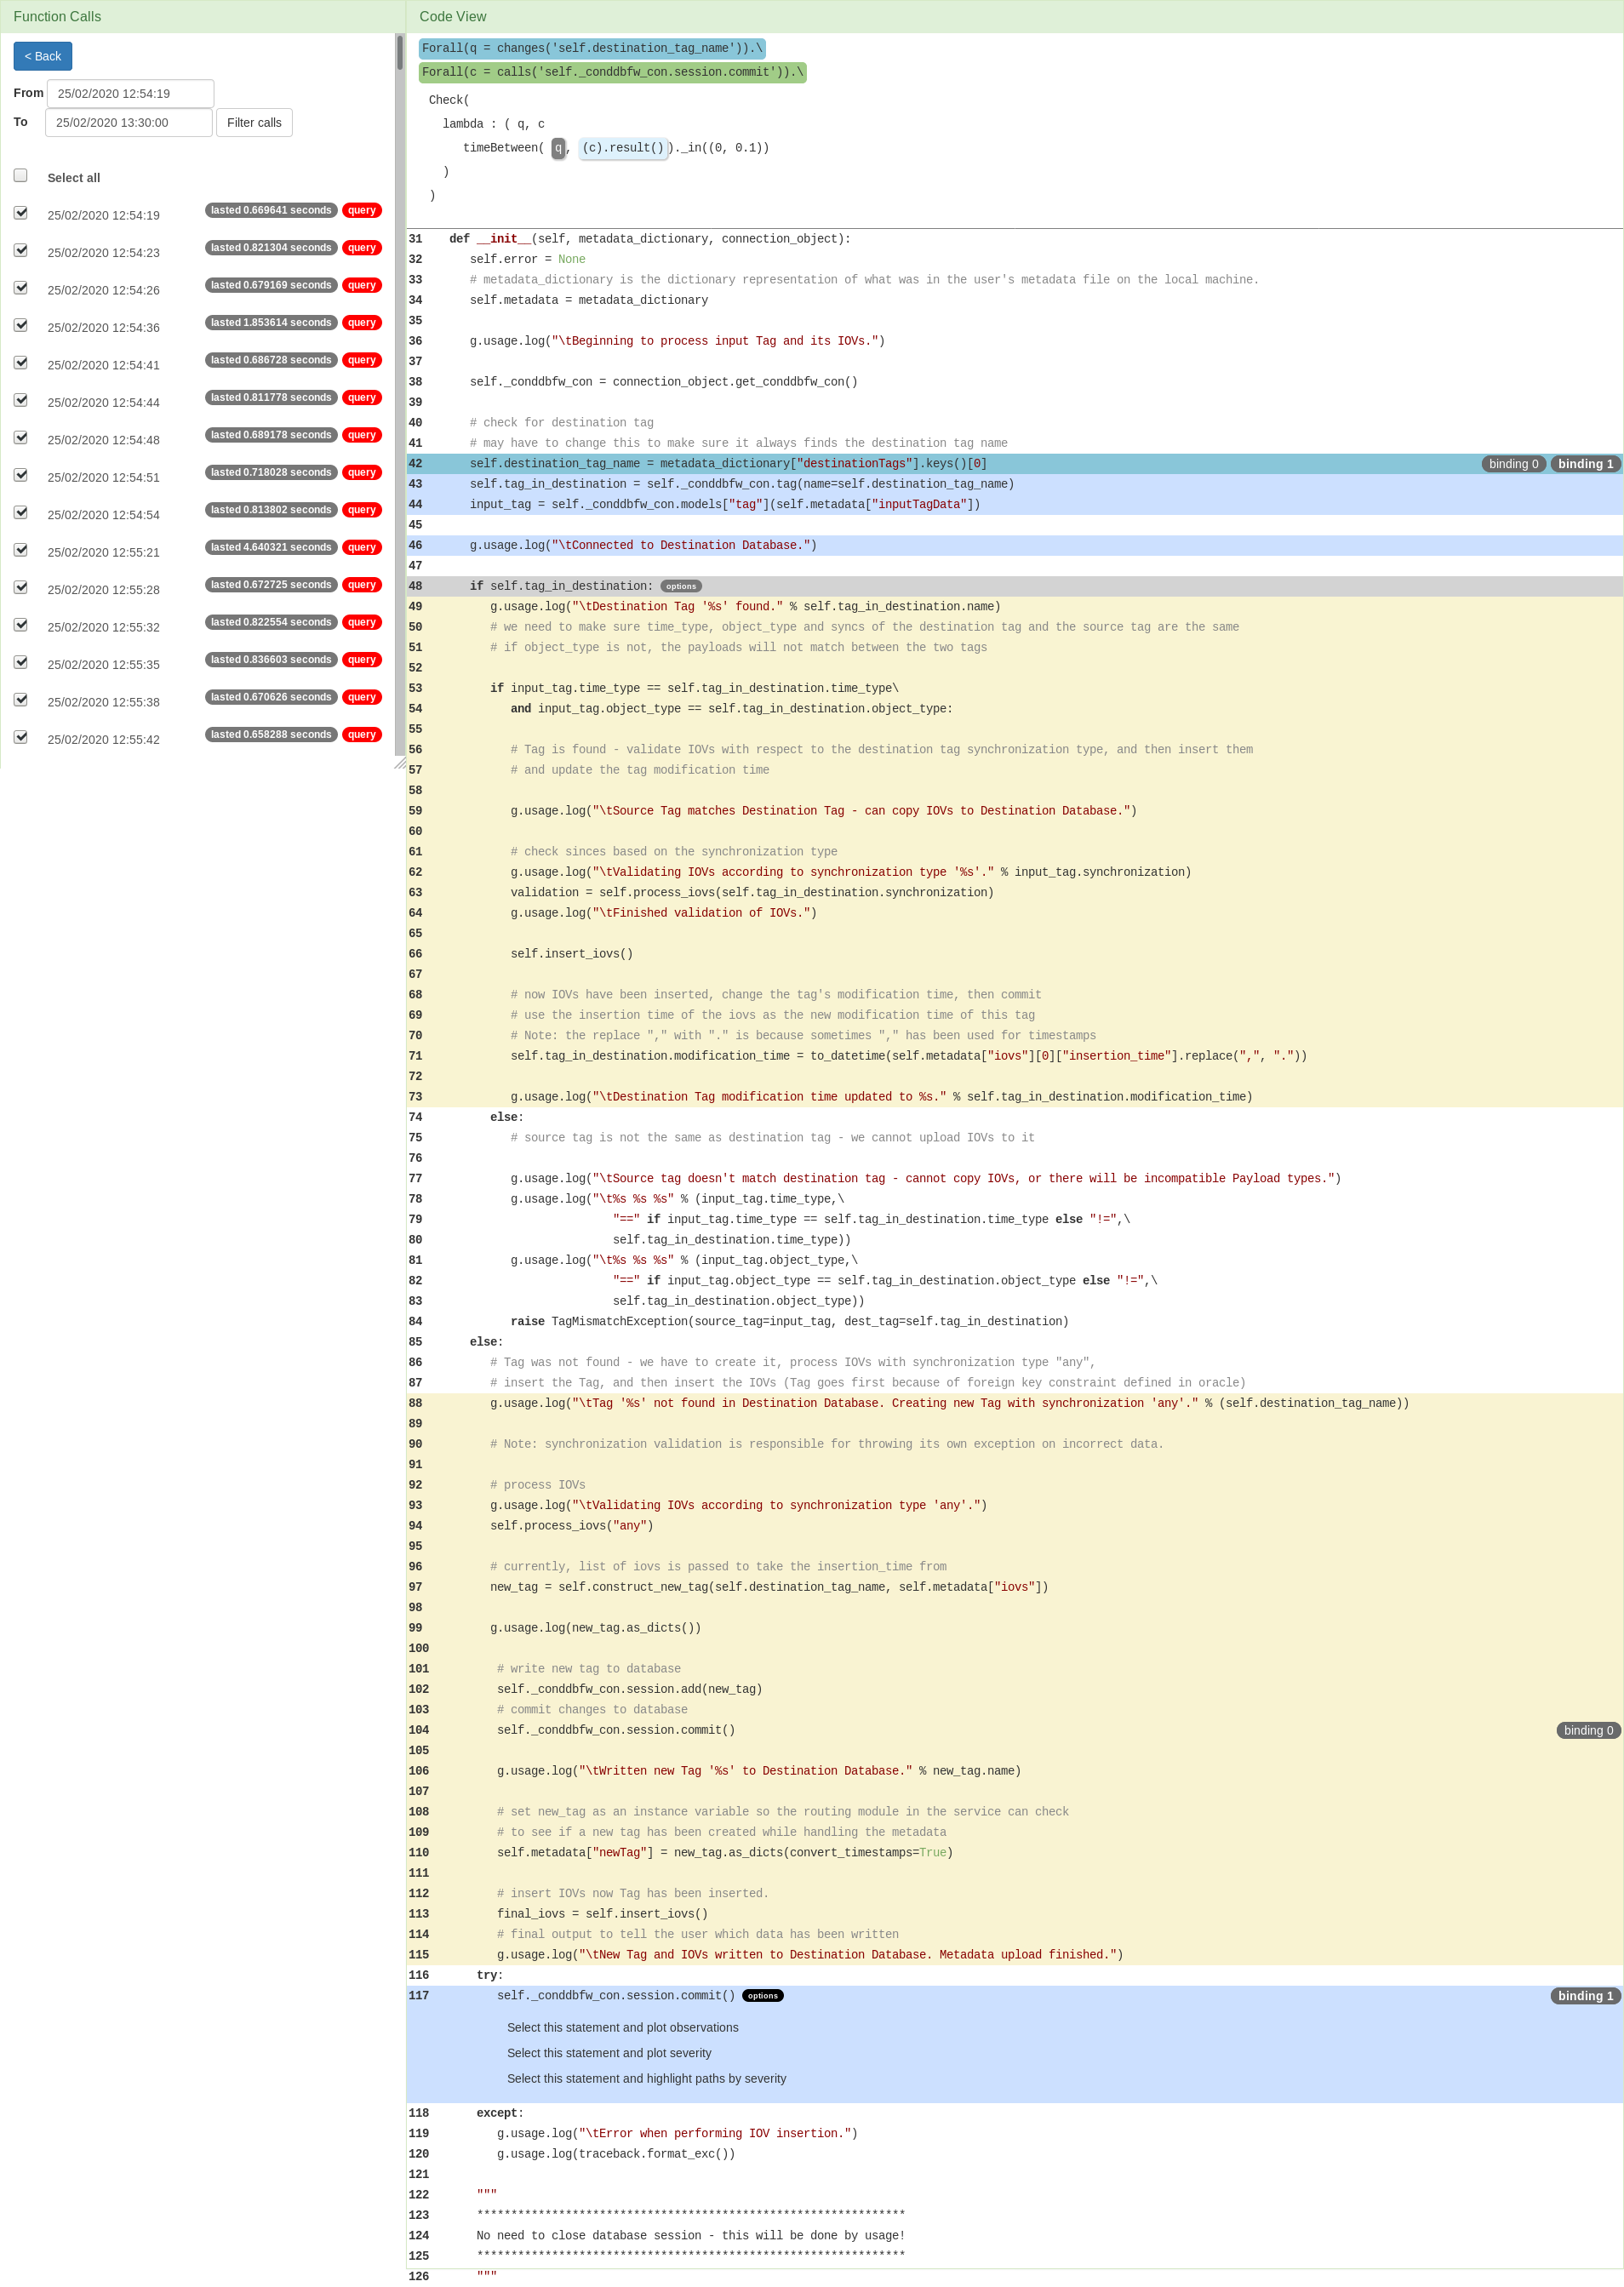
Since the query is about a pair of points, rather than just one, in order to analyse the performance, we need to select a pair of points in the code at which observations were taken. There can be more such pairs, which is why they are grouped by bindings. In this example, there are two bindings and we can filter the points in the code by selecting the binding of interest.
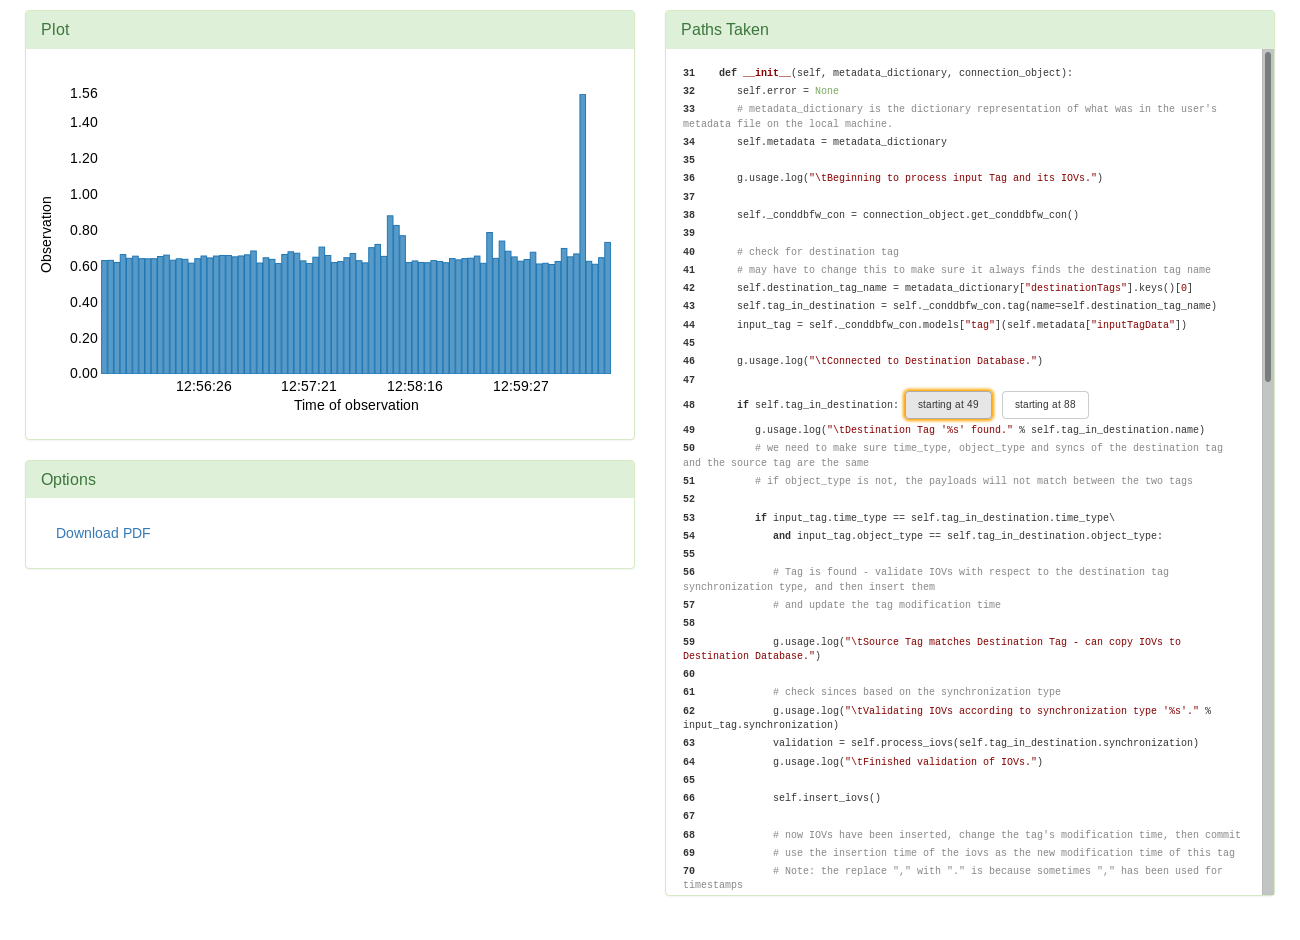
Additionally, when we are creating plots we need to select a pair of points the time between which we want to observe. At runtime, the time when each one is reached is recorded, but we need to pair them and calculate the difference. This is all done in the background, while the user only needs to select the pair of points of interest. Choosing the first one is an option available in the dropdown menu.
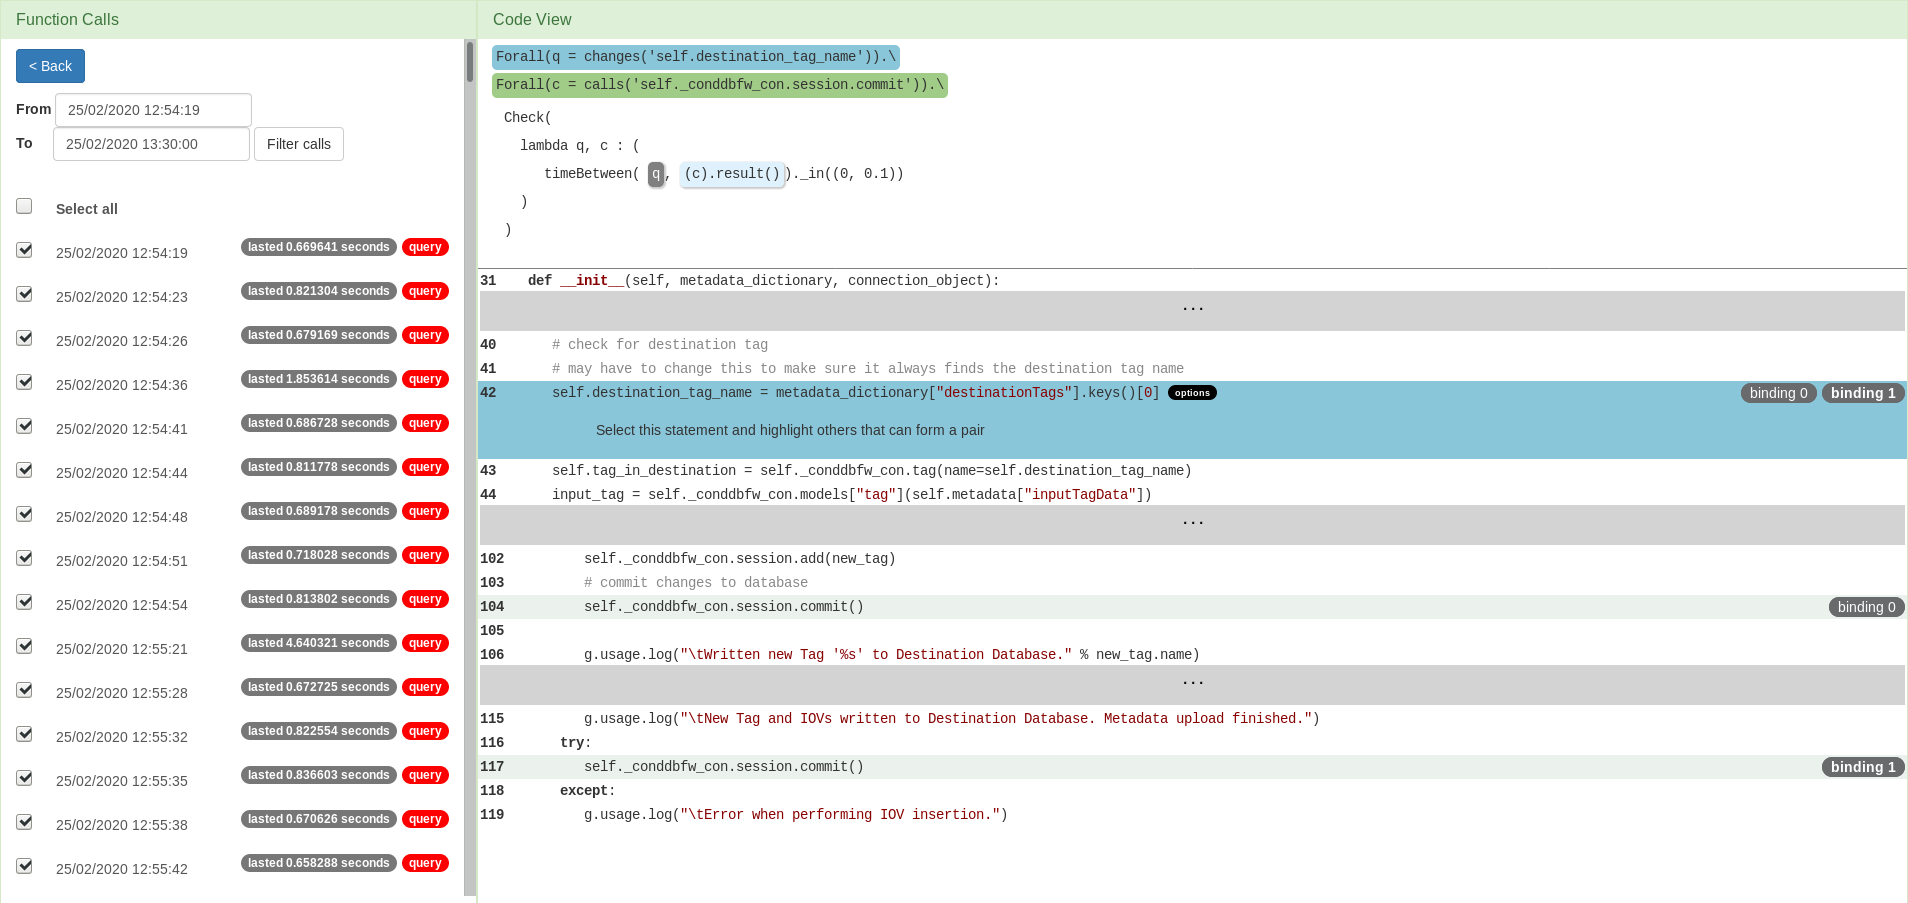
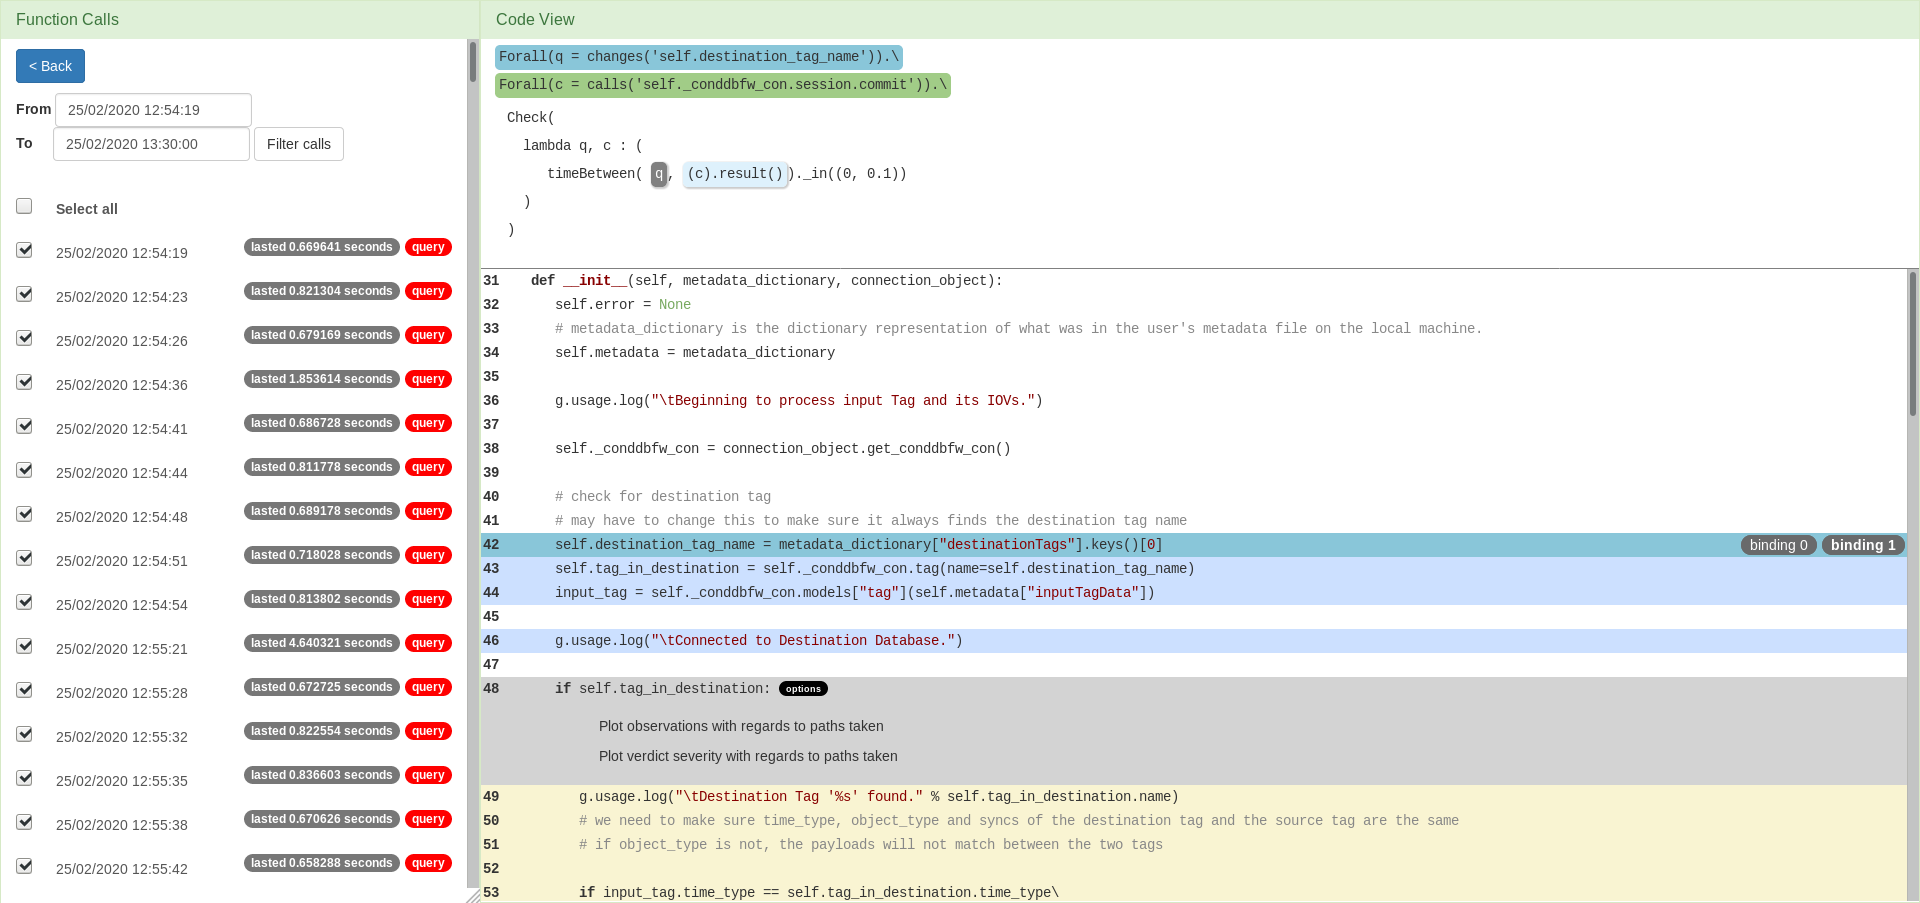
Additionally, when we are creating plots we need to select a pair of points the time between which we want to observe. At runtime, the time when each one is reached is recorded, but we need to pair them and calculate the difference. This is all done in the background, while the user only needs to select the pair of points of interest. Choosing the first one is an option available in the dropdown menu. Choosing the other one, along with the plotting option is available as shown below.
Visualisation
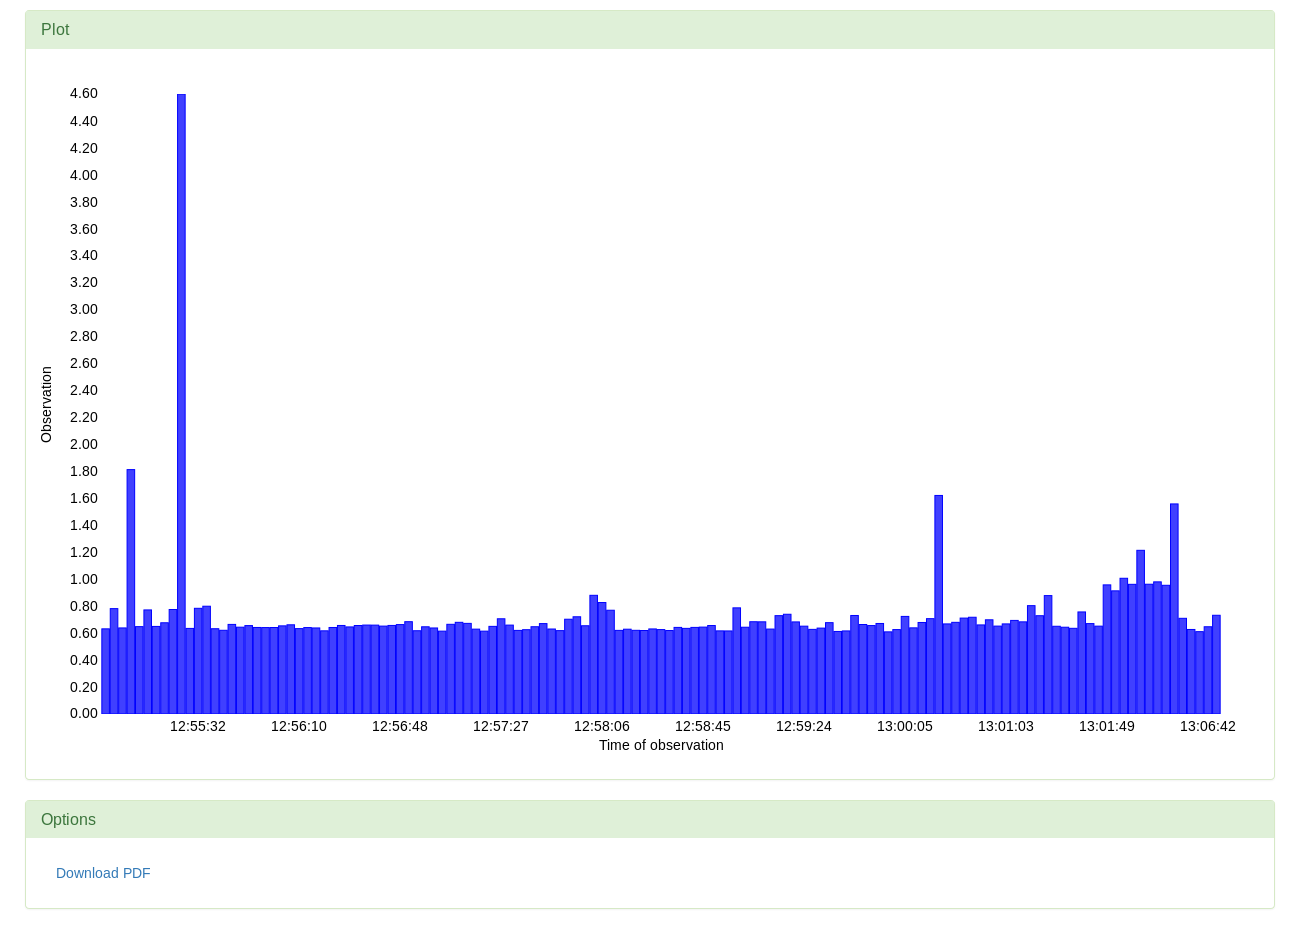
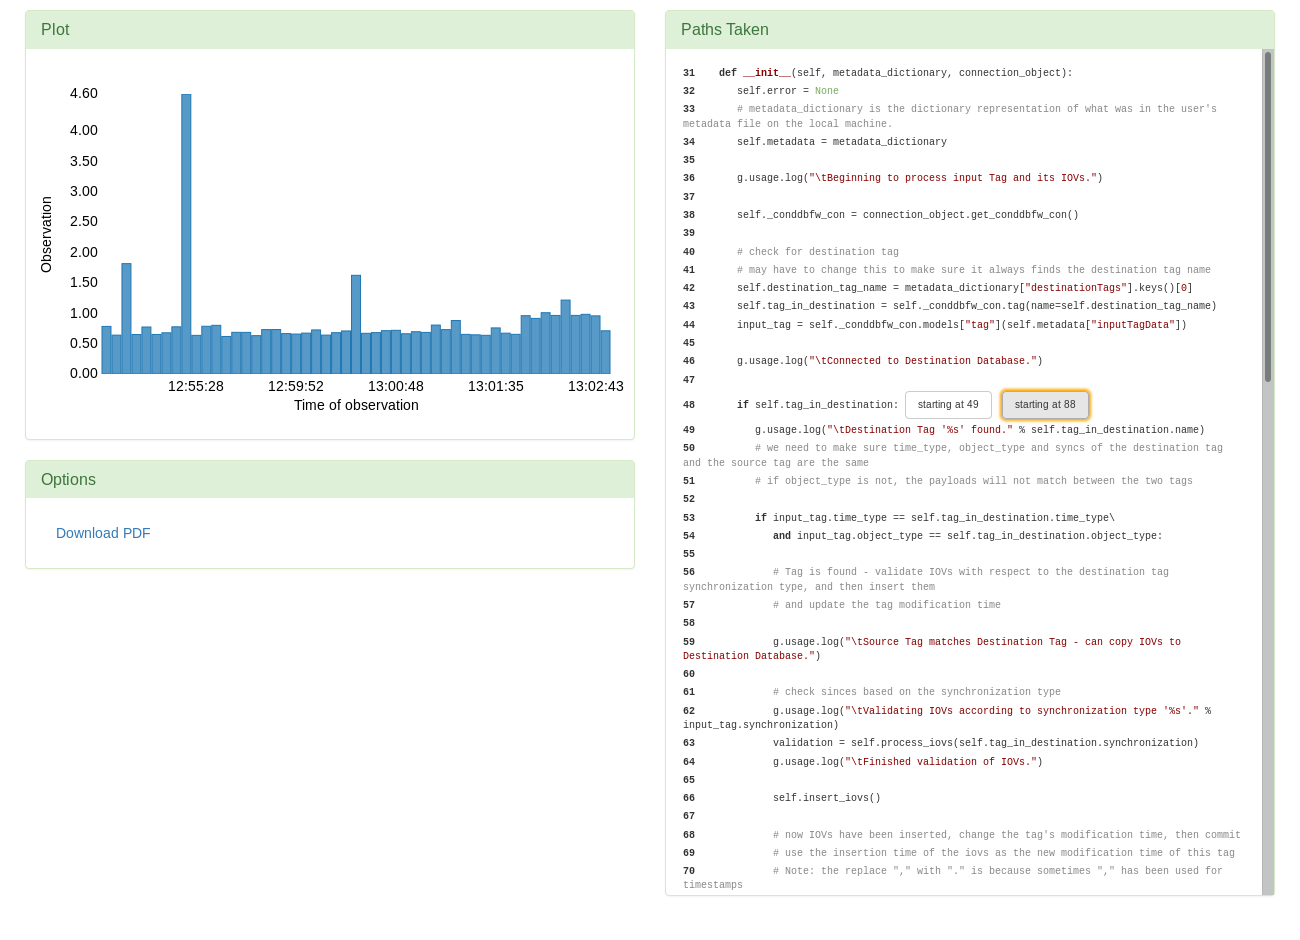
Observed time taken by the program run between the selected two points.
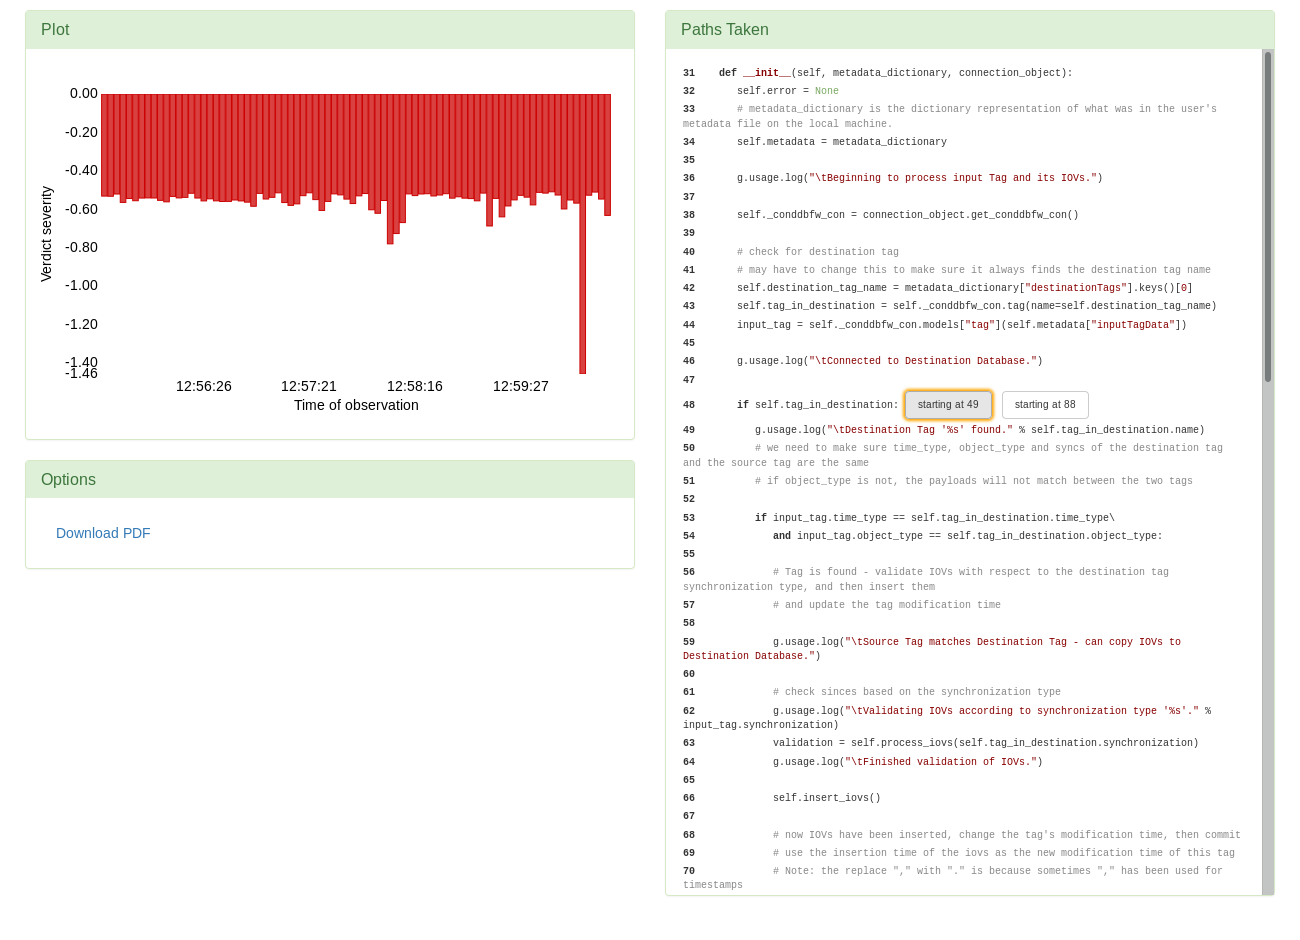
Verdict severity plot for the chosen pair.

Paths highlighted by severity.
Select a plotting option that creates plot with regards to path.
Select a plotting option that creates plot with regards to path.
Select a plotting option that creates plot with regards to path.
Select a plotting option that creates plot with regards to path.
Select a plotting option that creates plot with regards to path.
