A Guide through the VyPR Analysis Environment
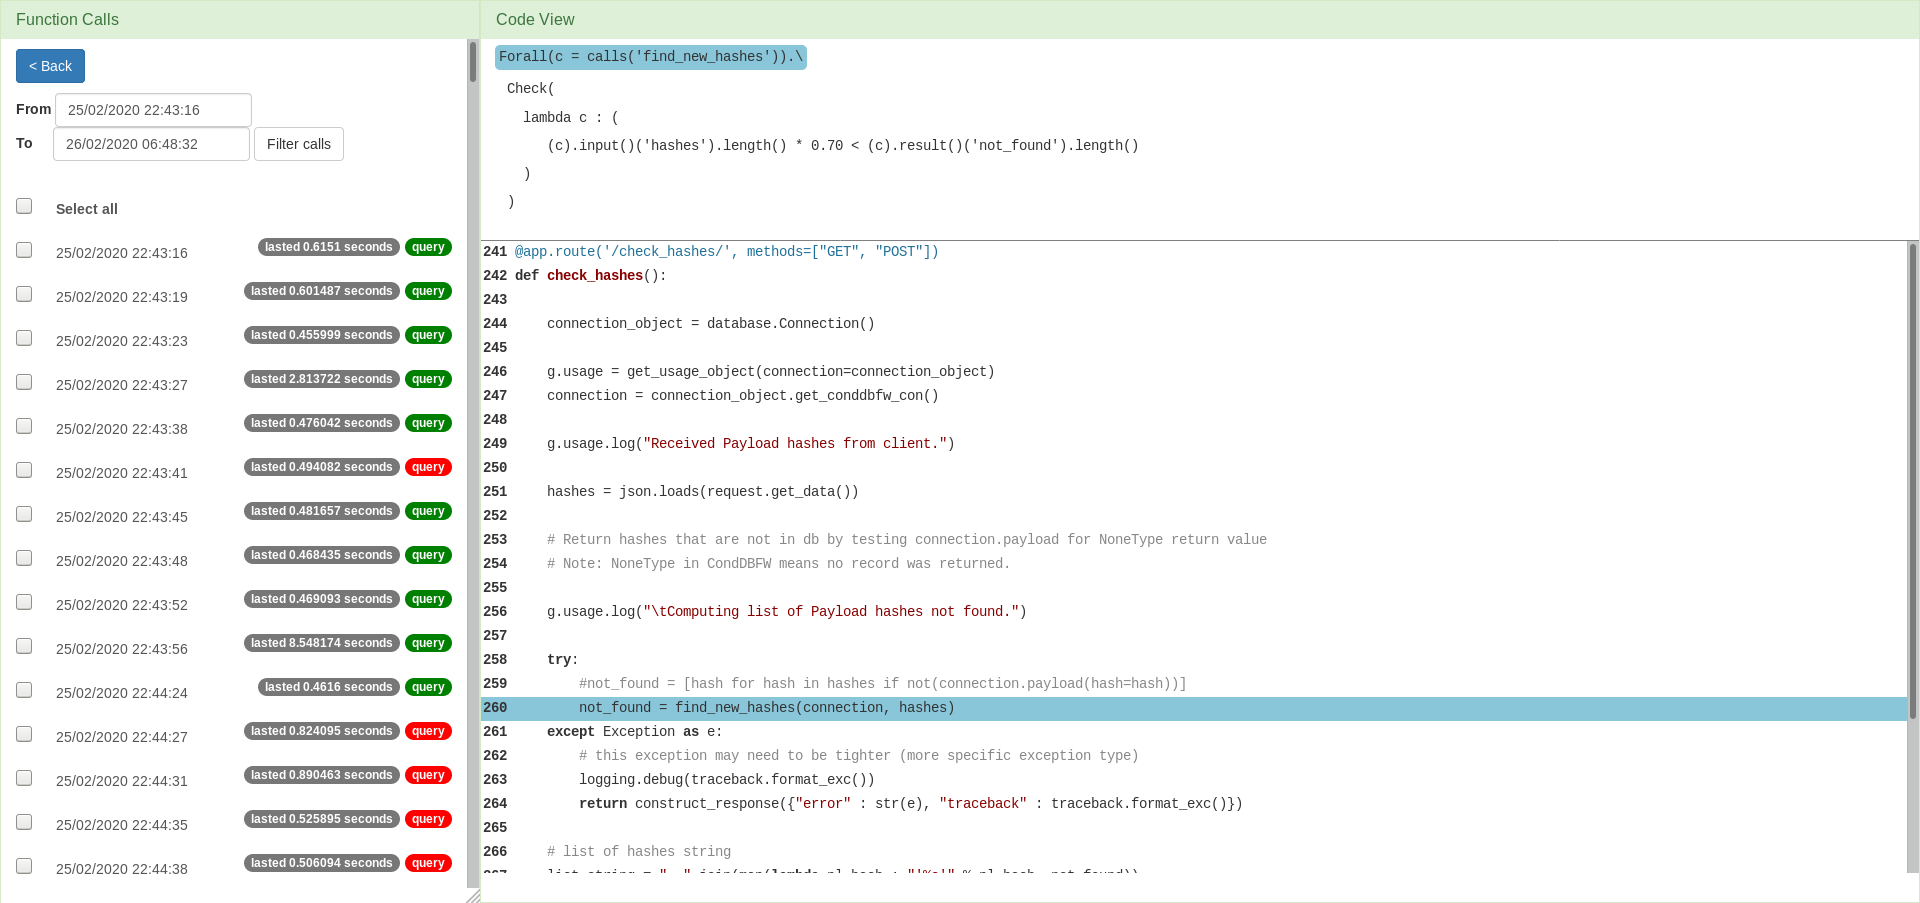
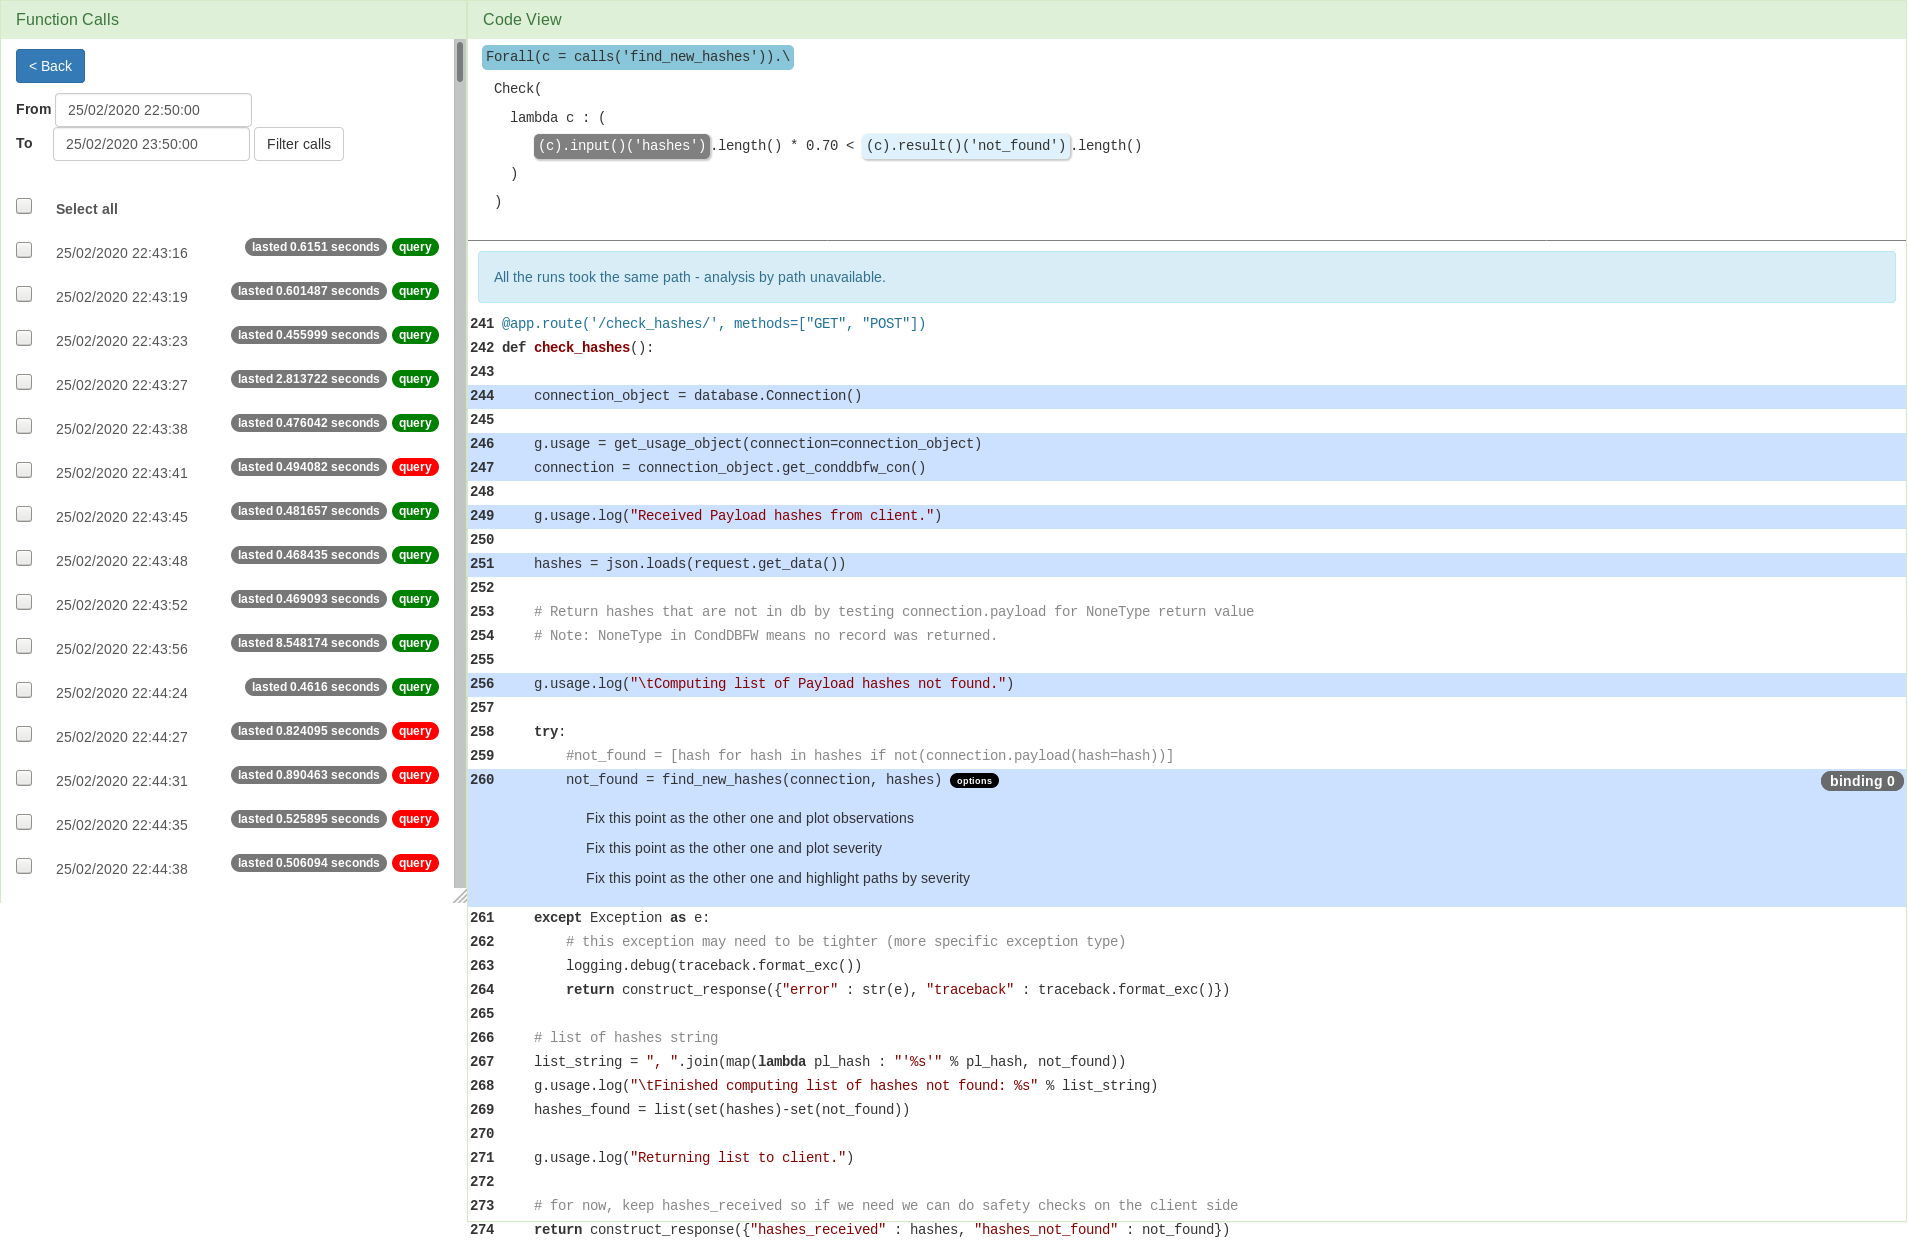
So far, we have seen a formula setting a constraint over the duration of a single function call, and another one setting a constraint over the time that a program run takes between two points in the code. Both formulas are placing a duration within an interval. The form of the specification we show below is somewhat different. Instead of measuring time, it deals with array lengths, specifying that the number of hashes not found should exceed 70% of the entire hashes list length. We want to visualise the comparison of the lengths. The first step is to select the query and filter the function calls.

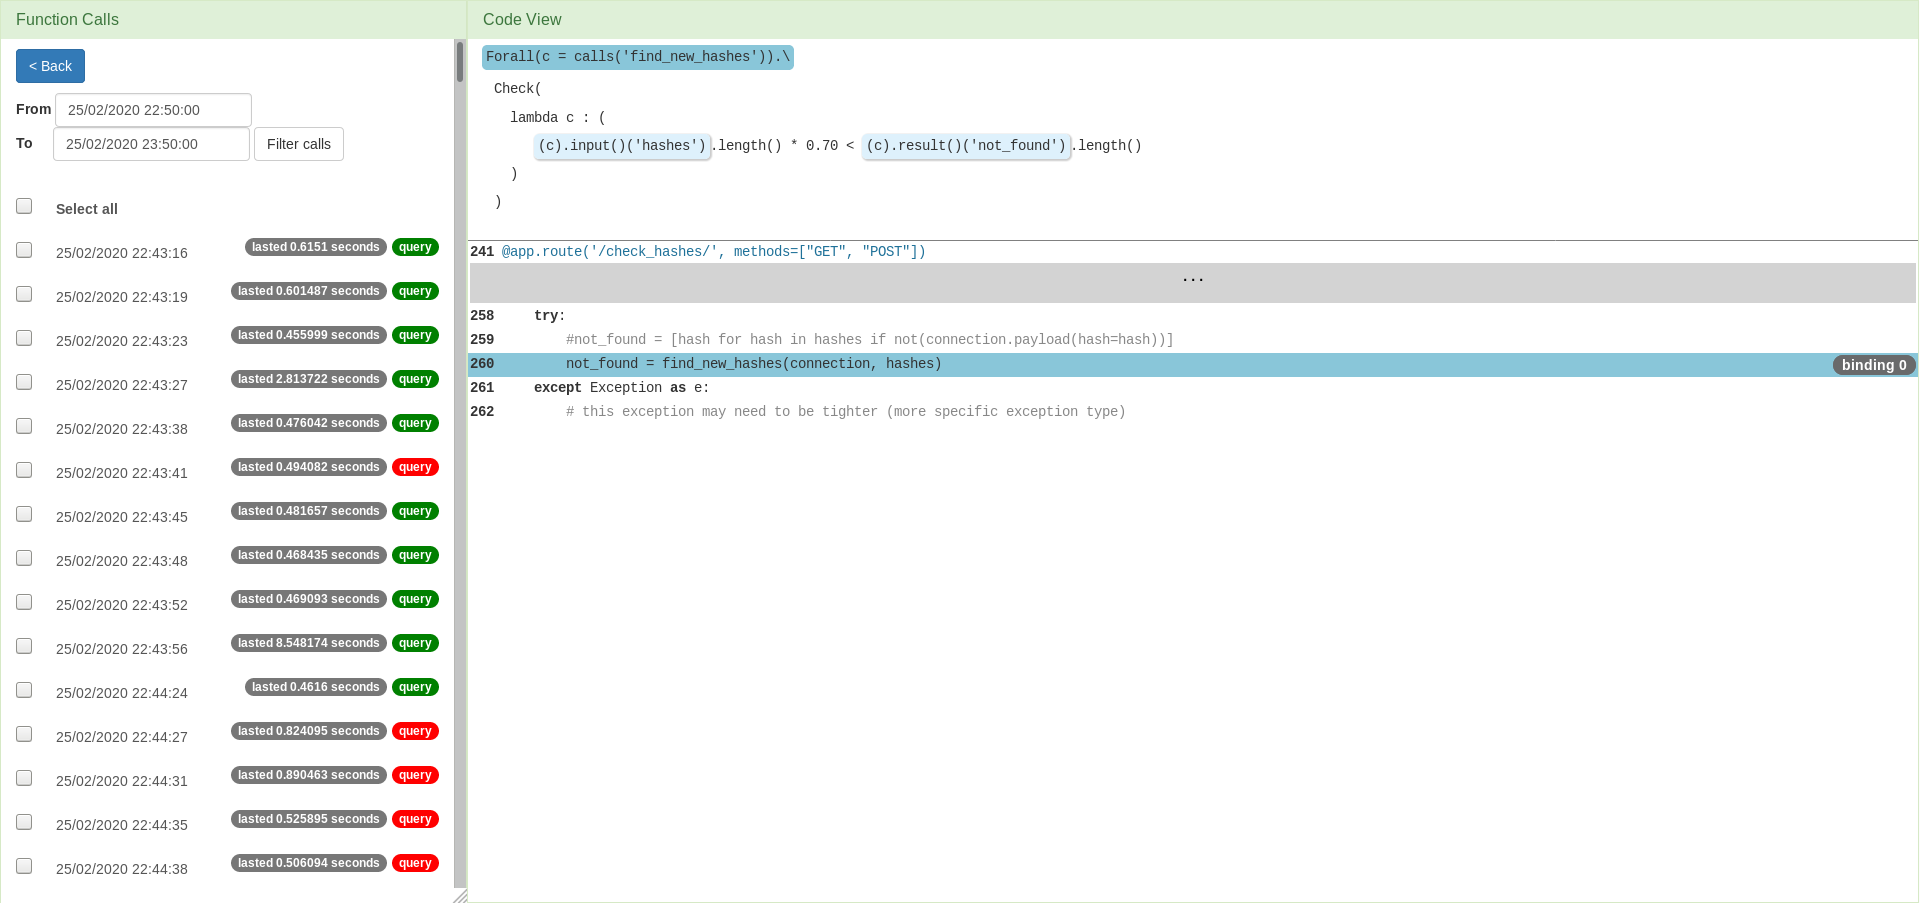
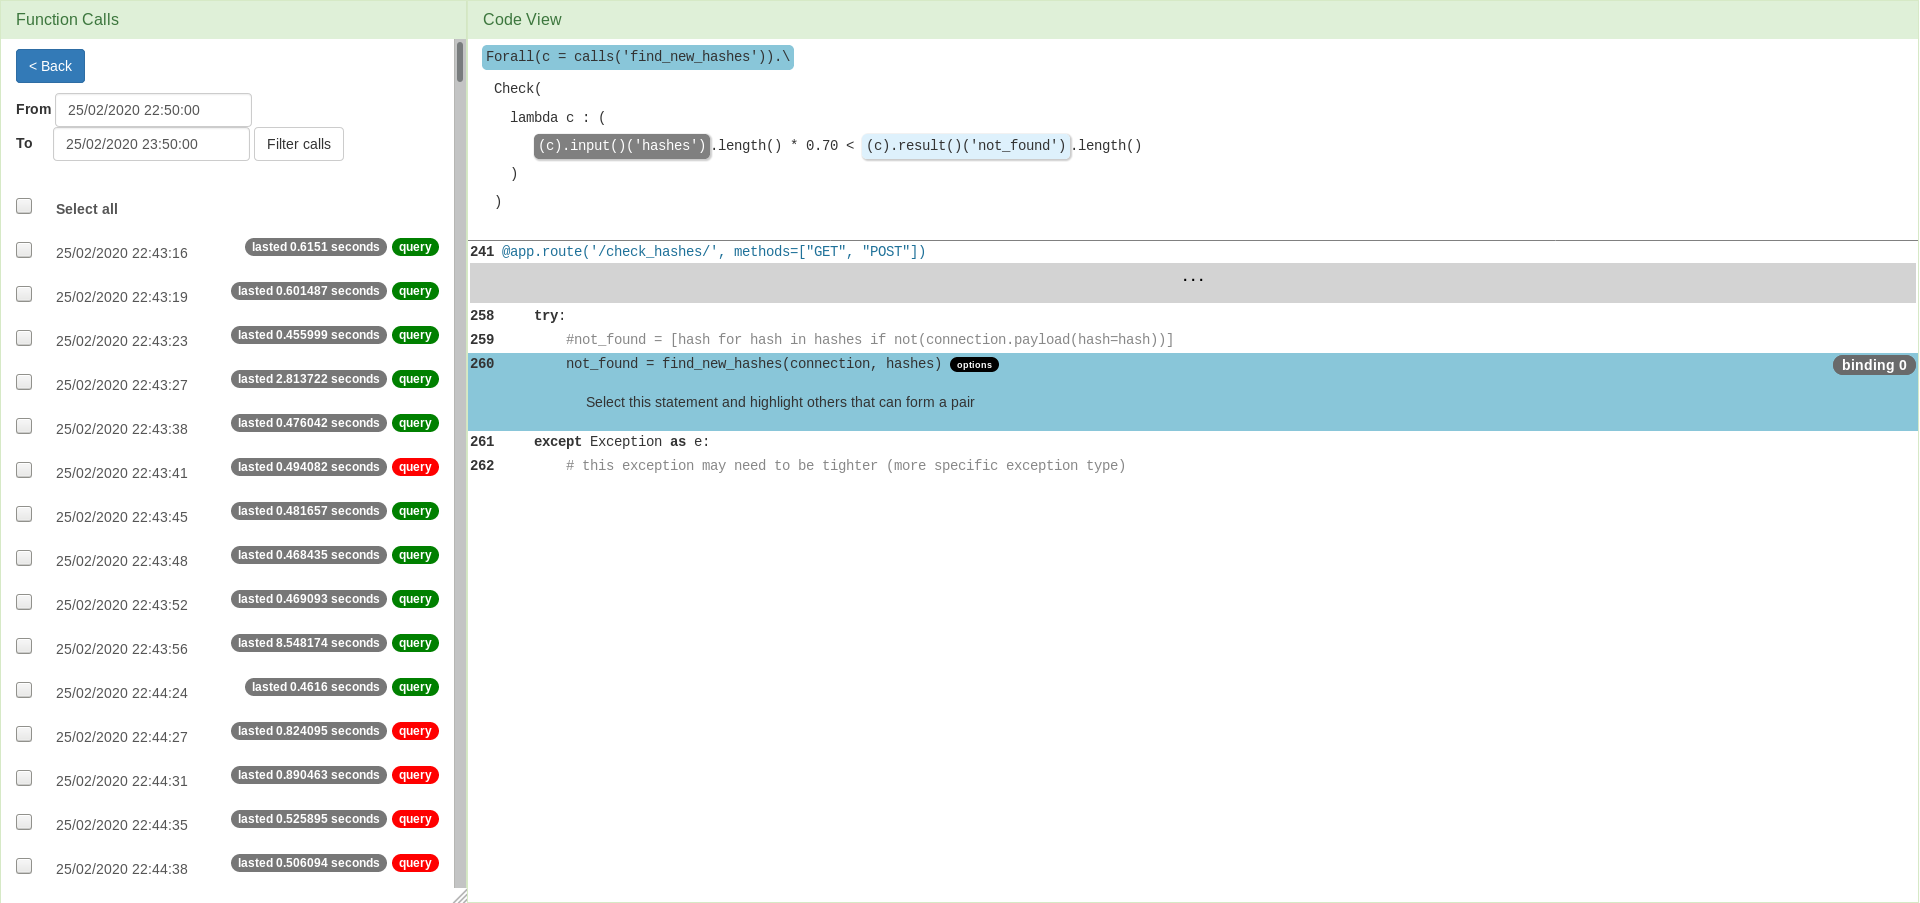
The query is about a pair of points, so in order to analyse the performance, we need to select a pair of points in the code at which observations were taken. There can be more such pairs, which is why they are grouped by bindings. In this example, there is only one binding we can select. Upon the binding selection, it remains to choose a sub-atom of interest. Note that both sub-atoms define instrumentation points at the same code line.
Visualisation
The observation plot shows the lengths of the arrays of interest observed at runtime. The legend indicates that the blue bars represent the length of hashes array and the orange ones the length of not_found array.
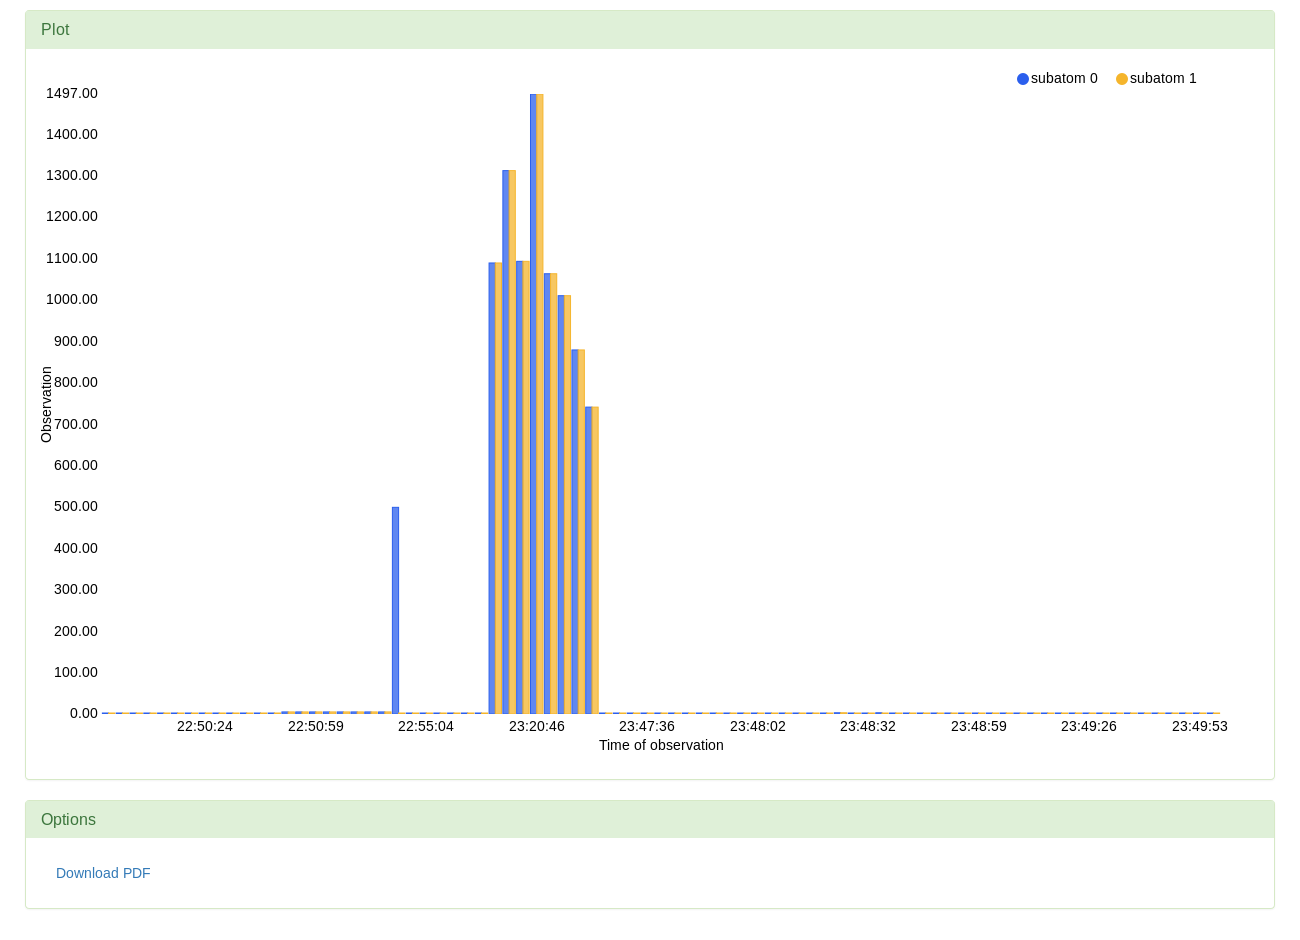
The observation plot shows the lengths of the arrays of interest observed at runtime. The legend indicates that the blue bars represent the length of hashes array and the orange ones the length of not_found array. The legend can also be used to filter the data to show only one of the quantities.

The observation plot shows the lengths of the arrays of interest observed at runtime. The legend indicates that the blue bars represent the length of hashes array and the orange ones the length of not_found array. The legend can also be used to filter the data to show only one of the quantities.

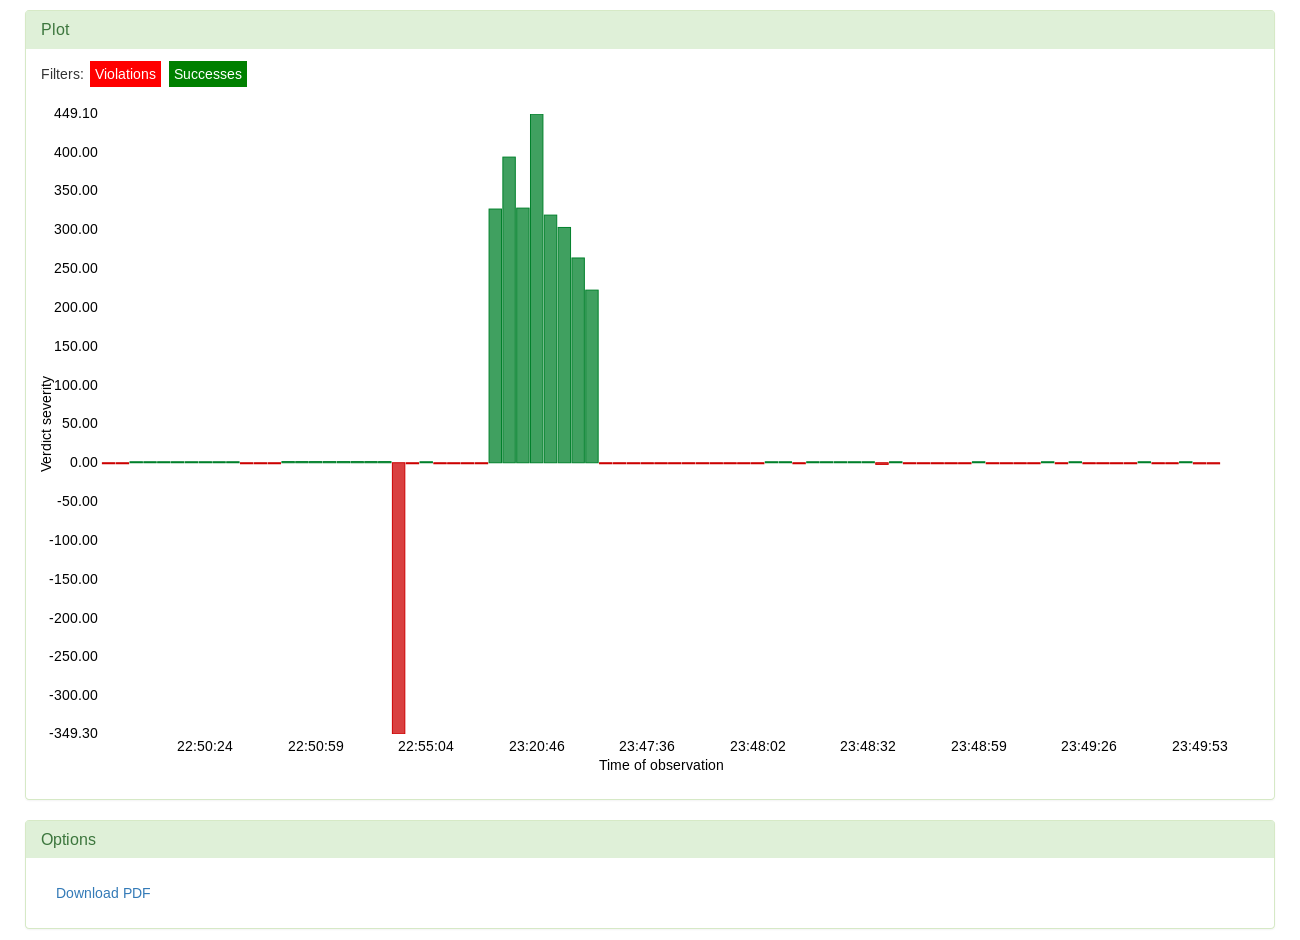
The lenghts can be viewed as independent quantities, but whether they satisfy the condition given in the query depends on both. The verdict severity is, in this case, calculated as the difference between the length of not_found and the length of hashes multiplied by the factor 0.7.
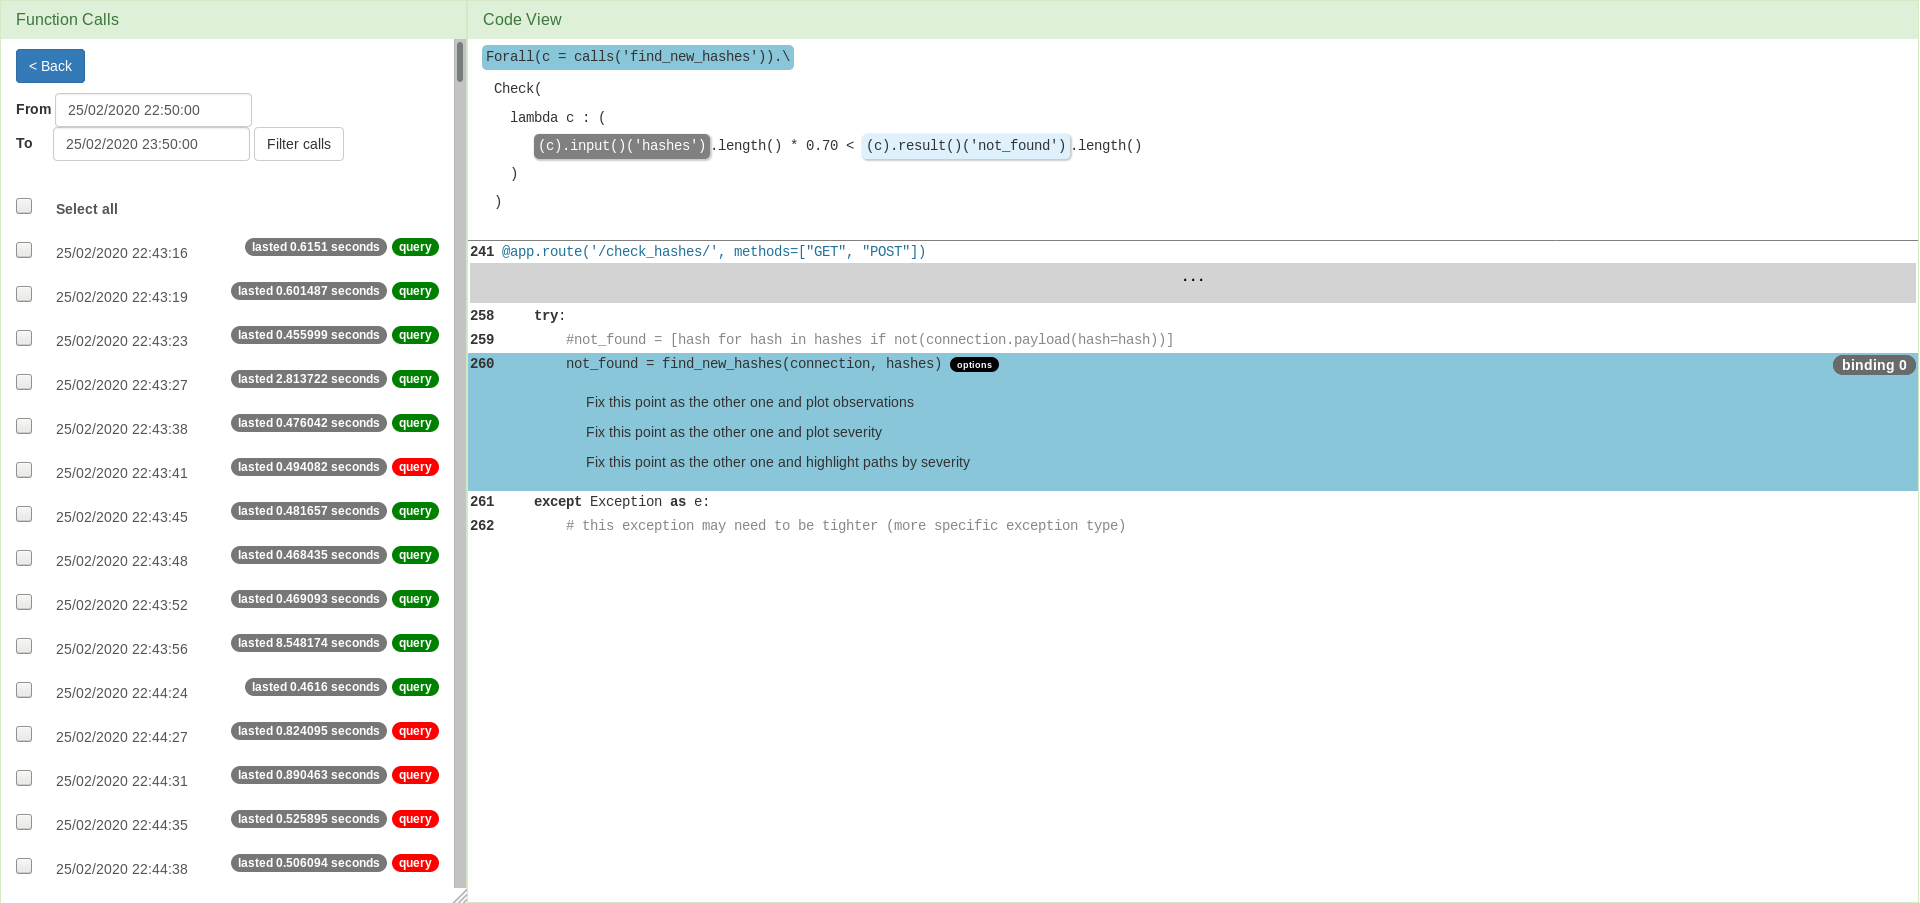
Selecting the path comparison option provides no further analysis options as all the runs took the same path.
Although the shown visualisation provides some insight into the gathered data, the plots are generated by the web tool without any intuition about the nature of the problem. The idea behind the query written over this program's performance was to see the ratio of the hashes not found to the total number of hashes. In this context, the options offered by the web tool are simple to use, but limited. Some analyses benefit from being performed using our Analysis Library instead, as writing analysis scripts allows more flexibility. The motivation behind this example, as well as the analysis script used to visualise the data in a different way can be found here.