A Guide through the VyPR Analysis Environment
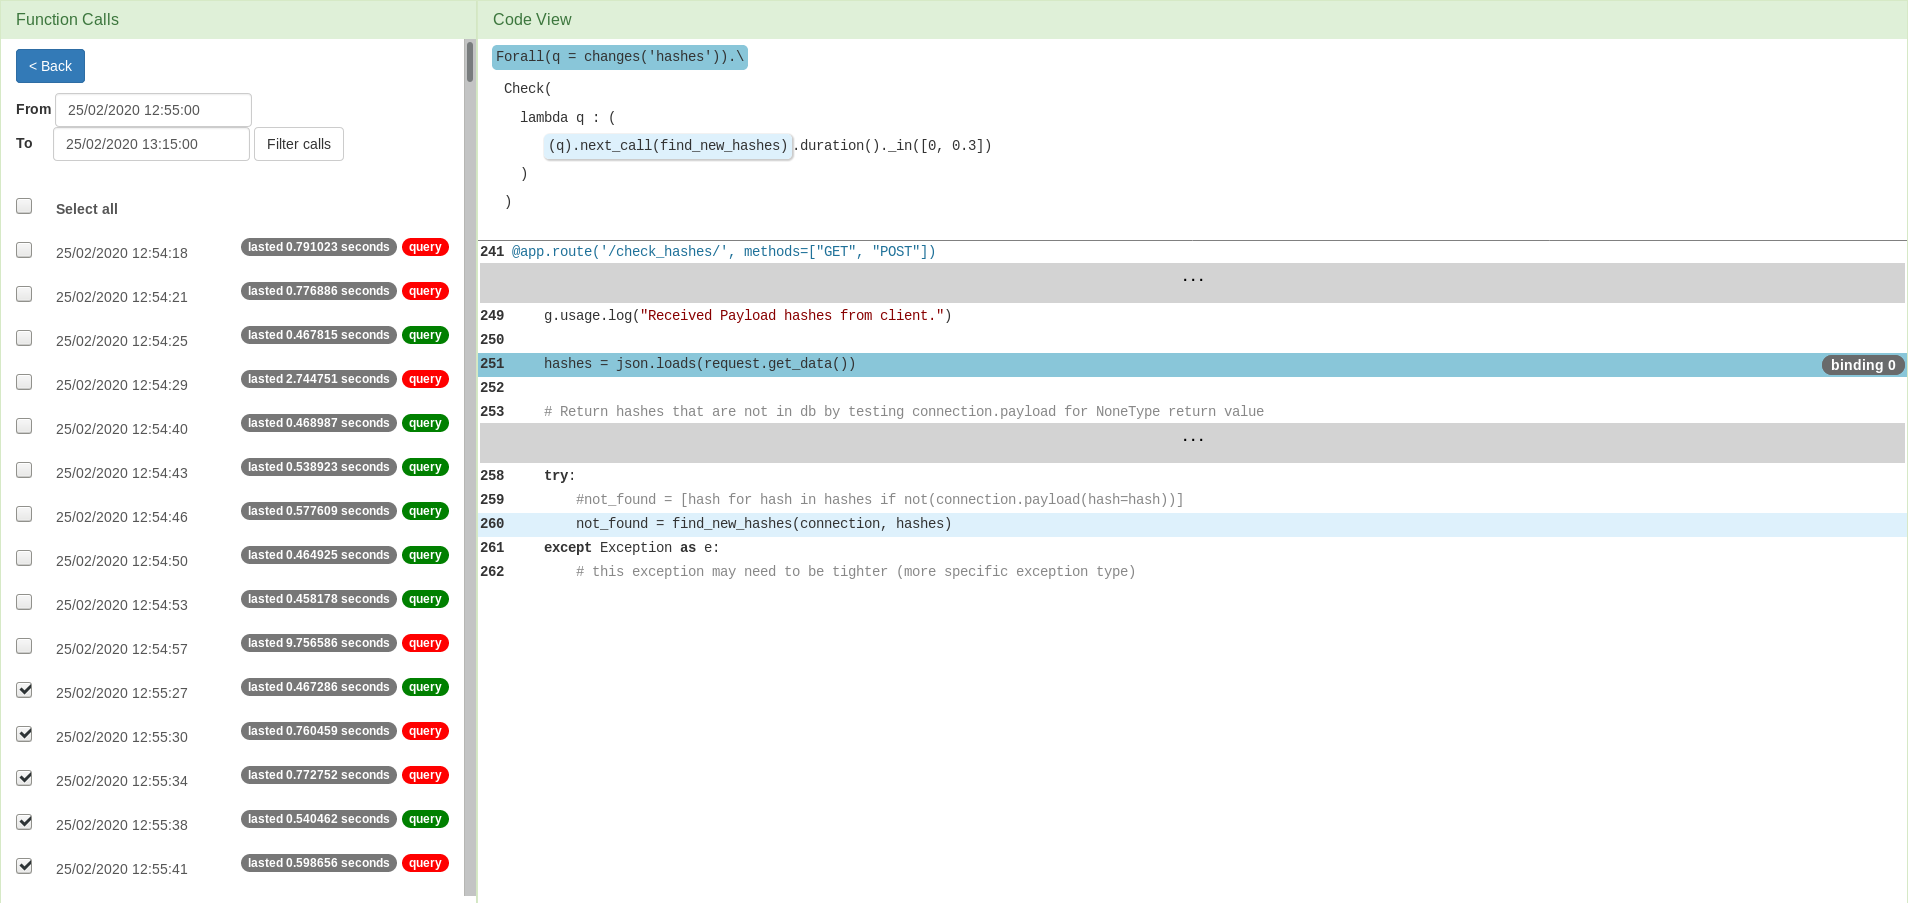
Upon the calls selection, only the lines of the selected function’s source code are shown that are relevant to the selected query. For example, you will see lines identified by quantifiers and lines identified by the code inside the selected query’s lambda.
Due to the fact that a variable can be changed, or a function called, at multiple points in the code, the points of interest are grouped by bindings. Hence, once function calls have been selected, the next step is to select the group of lines in the source code with respect to which you would like to see performance data. In the interface, these groups are called “bindings”.